On This Page
The eight-county Houston region has experienced dramatic changes in its population size and composition over the last few decades, and these trends are expected to continue. Where these new residents will live and work, as well as how they will travel in the region depends largely on the transportation system choices available to them.
H-GAC uses its own demographic models to forecast how many people and jobs will be in the region by 2040 based on expected future land uses and economic activity. The results are compared to national and state projections and adjusted when warranted. A main purpose of the demographic forecast is to support other predictive models used in the development of the RTP, such as the Travel Demand Model to calculate vehicle congestion and the Motor Vehicle Simulator-(MOVES) for air quality predictions. Beyond that, the demographic forecast gives an indication of how the region is expected to change in the coming decades.
What are the New Forecast Numbers?
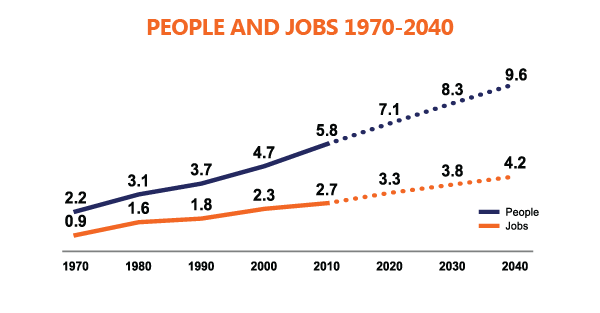
According to the 2010 US Census, the region had 5.8 million residents and 2.7 million jobs. By 2040 the region is expected to add 3.8 million more people for a total of 9.6 million residents. That is an increase of 66 percent over thirty years, or a 1.5 percent growth each year. Similarly for jobs, the region is expected to create an additional 1.5 million jobs for a total of 4.2 million.

Although the growth experienced by the region in the last decade has been among the fastest in the nation, it is significantly less that the growth rates experienced in past decades. In the coming decades, the region is expected to continue to grow vigorously, but at a slower rate than in the past.
An Aging Population
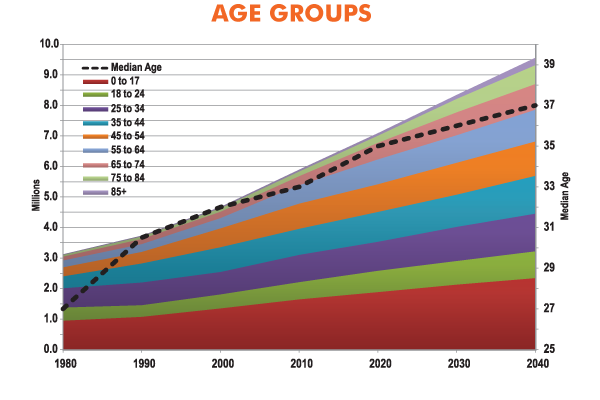
Population growth is only part the story. Over the next thirty years the population will become increasingly older. By 2040, the percentage of the population age 60+ will be nearly 10 percent higher than it is today. On the other end of the spectrum, people younger than 20 are expected to make up a smaller portion of the total population than they do today. The implication here is that fewer adult households will have children in schools.

Greater Ethnic Diversity
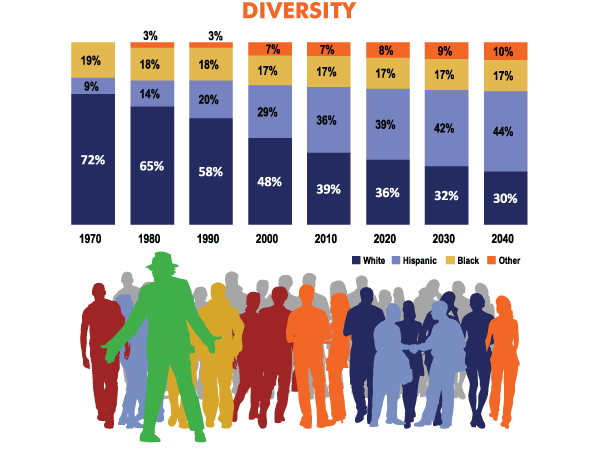
Another part of the story is the growing ethnic diversity of the region. Since the 1980s, the US Census figures show that the share of white residents in the region has decreased, while the share of Hispanic residents has increased.
In 2000, the Census showed for the first time that white residents were no longer in an absolute majority. In 2010, whites outnumbered Hispanics by only a few percentage points. By 2020, the ratio of white to Hispanics is expected to reverse.
In the future, the further growth of the Hispanic population is expected to slow, so that by 2040 the proportion of ethnic groups will be relatively stable.

Other Areas of Growth
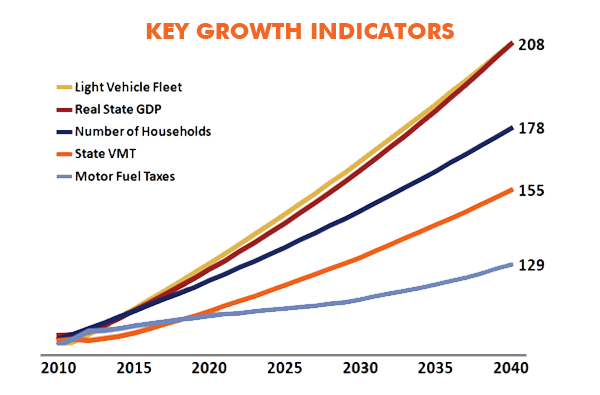
This projected population growth will bring about other changes, including economic ones stemming from increased purchasing power and more tax revenue earned. The chart below tracks the growth of five key statewide indicators. All five start in 2009 with a value of 100, and the growth rates through 2040 are shown on the right.

Light Vehicle Fleet (meaning all cars and light duty trucks such as pickup trucks) and Real State GDP (Gross Domestic Product) are both forecast to double in size from what they were in 2009. This means that twice as many cars and light trucks are expected to be registered in the state. Similarly, the statewide economy—measured by gross domestic product (the market value of all officially recognized final goods and services produced within Texas)—is forecast to double.Next, the number of households is expected to increase by over 75%.
The State VMT (vehicle miles traveled) is projected to grow by only 55%, an indication that the state is urbanizing. Typically, trips are shorter in urban areas as stores and other destinations are closer to where people live, as opposed to rural areas, where distances tend to be longer.
The most important line on the chart is the bottom one: Motor Fuel Tax—the revenue raised on gasoline and diesel that directly support the state’s transportation system. This revenue stream is going to increase by only roughly 30%. Why is this growth so low? Primarily for three reasons:
- Statewide, we are driving less
- Vehicles are becoming more fuel efficient
- The tax rates on gasoline and diesel were last increased in the early 1990s, and inflation has decreased the purchasing power of the money collected.
Motor fuels, gasoline and diesel, are taxed by both state and federal governments. The state tax on gasoline and diesel is 20 cents per gallon, and the federal tax is 18.6 cents per gallon for gasoline and 24.4 cents per gallon for diesel making a total combined tax of 38.6 cents for gasoline and 44.4 for diesel. If these tax rates would have been tied to inflation, today’s combined tax on gas would be 59.2 cents and 68.1 cents on diesel.
Given the Motor Fuel Tax’s low rate of growth, how do we maintain a transportation system robust enough to support our economy, driving habits, and settlement patterns? The transportation system is expensive to build, operate and maintain. If we do not have the desire to increase taxes, how else can we make sure we will have a transportation system that meets our needs by 2040?
The Future
What do these demographic and economic changes mean for the Houston region? For one, retired and elderly populations tend to drive less and are more dependent on walking or public transit to reach their destinations. Therefore, it is reasonable to expect that more elderly residents will use the public transit system as they lose the ability or choose not to drive.
Ethnic shifts, as well as generational shifts, can also bring new values and priorities with respect to housing and lifestyle choices. The strong desire for individual families to reside in single-family detached housing, common in the region for most of its history, may give way to a desire for more urbanized housing. Active transportation choices, such as walking and biking, especially in urban core areas, are becoming more popular for many people.
If we expect to have the same level service as we enjoy today, we will need to find new sources of revenue for building, operating and maintaining the transportation system.

