
On This Page
Federal legislation introduced Transportation Performance Management to address challenges facing the transportation system. As a Metropolitan Planning Organization for the greater Houston area, H-GAC sets targets and is reporting on the progress towards targets. H-GAC has the responsibility for these federal performance measures in a variety of key performance areas.
Key Performance Areas
Safety
Reducing fatalities and serious injuries for vehicles, pedestrians and bicyclists.
Pavement & Bridges
Maintaining good condition is critical to safety, the movement of goods and people and economic development.
Reliability
Making travel more reliable for personal travel and trucks moving freight.
Congestion
Assess and measure hours of peak hour excessive delay and plan for an increase in multi-occupant vehicle use or ridesharing to reduce congestion.
Air Quality
Reducing tailpipe emissions by funding CMAQ-eligible projects, resulting in better air quality for the region.
Transit Asset Management
Preserving the conditions of public transportation vehicles and facilities for moving to a State of Good Repair is a priority. Ultimately, these assets support a multi-modal network that the region can depend on.
Public Transportation Agency Safety Plans
Reducing fatalities and injuries while protecting transit passengers and employees.
The Process for Measuring Performance

H-GAC gathers data of current conditions, formulates a quantitative forecast, sets targets for improving the performance of the transportation system, then, over time, monitors the conditions and reports if the goals were reached.
Performance management is a powerful analytical tool for tracking regional performance over time and can illustrate how we are meeting the regional goals for improved performance of the transportation system.
Performance measurement is not a new concept to H-GAC. Many of the federal performance measures align and compliment H-GAC’s existing performance measures found in the Regional Mobility Report.
How do we achieve progress in these performance areas?
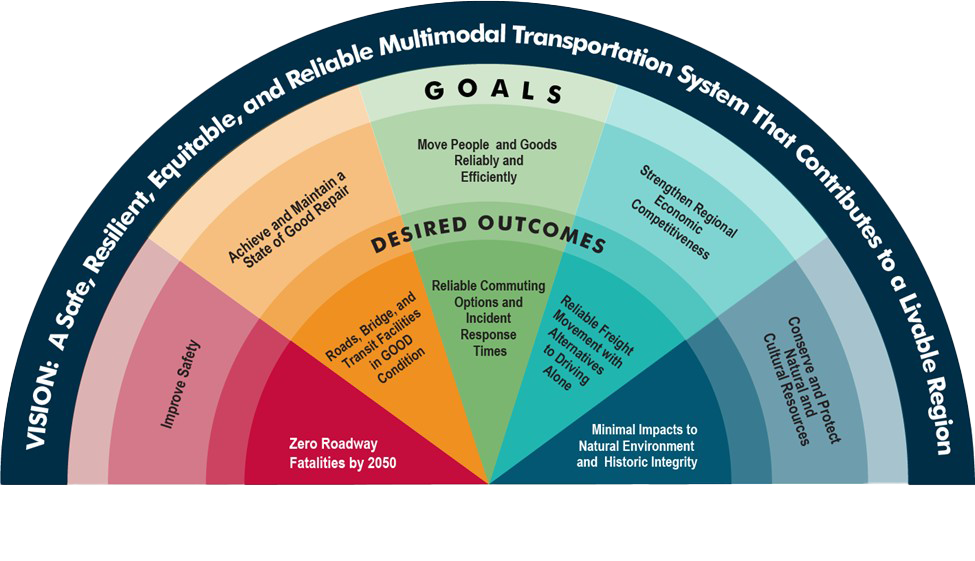
The 2045 Regional Transportation Plan Update prioritizes transportation investments that will contribute towards achieving the performance targets. 2045 RTP Update is a long-range plan centered around a shared regional vision: an aspirational statement about the desired future transportation system for the Houston-Galveston region.
Five goals were chosen to actuate the vision, each of which were assigned performance measures that would indicate the progress made towards achieving the goal. The figure below shows the relationship between the 2045 RTP Update vision, goals, desired outcomes and performance measures.
Safety
Safety is a top regional priority. Although motorists are the largest group of system users injured or killed in crashes, pedestrians and cyclists are also at risk. A safe regional transportation system operates reliably, delivers goods and services on time, and returns users home at the end of their trip.
| Safety Performance Measures | |
|---|---|
| Number of Fatalities | Five-year rolling average of the number of vehicular fatalities |
| Rate of Fatalities | Five-year rolling average of the rate of vehicular fatalities |
| Number of Serious Injuries | Five-year rolling average of the number of vehicular serious injuries |
| Rate of Serious Injuries | Five-year rolling average of the rate of vehicular serious injuries |
| Number of Non-motorized Fatalities & Serious Injuries | Five-year rolling average of the number of non-motorized fatalities and serious injuries for bicyclists and pedestrians |
Pavement & Bridge
Ensuring the preservation of pavements and bridges is critical to safety, the movement of goods and people, and economic development.
While the federal performance measures are focused on the National Highway System, H-GAC is concerned with the conditions of all pavements and bridges.
| Pavement & Bridge Performance Measures | |
|---|---|
| Interstate pavements in good condition | Percentage of pavements of the Interstate National Highway System with a condition rating of Good based on evaluation scores of ride quality. |
| Interstate pavements in poor condition | Percentage of pavements of the Interstate National Highway System with a condition rating of Poor based on evaluation scores of ride quality. |
| Non-Interstate pavements in good condition | Percentage of pavements of the Non-Interstate National Highway System with a condition rating of Good based on evaluation scores of ride quality. |
| Non-Interstate pavements in poor condition | Percentage of pavements of the Non-Interstate National Highway System with a condition rating of Poor based on evaluation scores of ride quality. |
| National Highway System bridge deck area in good condition | Percentage of bridge deck area of the National Highway System with a condition rating of Good based on evaluation ratings. |
| National Highway System bridge deck area in poor condition | Percentage of bridge deck area of the National Highway System with a condition rating of Poor based on evaluation ratings. |
System Performance
The System Performance Group contains a set of performance measures place focus on personal travel, as well as, freight, reducing congestion and tailpipe emissions, and increasing multi-occupant vehicle use.
Improving the system performance of the transportation network means there will be more reliable and less congested roadways, resulting in better air quality for the region.
| Reliability Performance Measures | |
|---|---|
| Interstate Reliability of Person Miles Traveled | Percentage of person miles traveled on the interstate National Highway System that meet the federal threshold for being reliable. |
| Non-Interstate Reliability of Person Miles Traveled | Percentage of person miles traveled on the non-interstate National Highway System that meet the federal threshold for being reliable. |
| Interstate Truck Travel Time Reliability Index | Truck index is the amount of extra time that interstate truck drivers need to add to a median trip to arrive at their destination on-time. |
| Congestion & Air Quality Performance Measures | |
|---|---|
| Peak Hour Excessive Delay | For all vehicle types, these are the hours of extra travel time spent in peak traffic, under excessive delay conditions, annually, per capita. |
| Non-Single Occupant Vehicle Trips | This is the percent of commuting to work trips when ridesharing with other commuters that includes travel avoided by telecommuting. |
| On-Road Mobile Source Emission Reductions | Tailpipe emissions reduced by the construction of transportation projects funded with Congestion Mitigation Air Quality. |
Transit Asset Management
Transit Asset Management is a strategic and systematic process of operating, maintaining, and improving public capital assets effectively through their entire life cycle.
The capital asset inventories include transit rolling stock (revenue vehicles), equipment, non-revenue vehicles, facilities and rail infrastructure.
Investment prioritizations, decision support tools, as well as, risk mitigation, maintenance, acquisition and renewal strategies are the core activities of the TAM Plans.
| Transit Asset Management Performance Measures | |
|---|---|
| Rolling Stock (revenue vehicles) | Percent of vehicles that have met or exceeded their Useful Life Benchmark* |
| Equipment (non-revenue vehicles) | Percent of non-revenue vehicles that have met or exceeded their Useful Life Benchmark* |
| Facilities (buildings and structures) | Percent of facilities with a condition rating of Marginal or Poor (rating below 3.0 on the TERM scale**) |
| Infrastructure (rail tracks, signals & systems) | Percent of rail infrastructure with performance/speed restrictions |
*Useful Life Benchmark (ULB) is the expected lifecycle of a capital asset for a transit provider’s operating environment, or the acceptable period of use in service for a transit provider’s operating environment.
**Transit Economic Requirements Model (TERM) Scale: Facility condition assessments reported to the National Transit Database (NTD) have one overall TERM rating per facility.
| Condition Rating | Rating Range |
|---|---|
| Excellent | 5.0 - 4.8 |
| Good | 4.7 - 4.0 |
| Adequate | 3.9 - 3.0 |
| Marginal | 2.9 - 2.0 |
| Poor | 1.9 - 1.0 |
Public Transportation Agency Safety Plans
Transit providers who are recipients and subrecipients of federal transit assistance under FTA's Urbanized Area Formula Grants (Section 5307) are required to develop safety plans and Safety Management Systems focused on protecting passengers and employees. The objective of a Safety Management Systems is to create a collaborative approach for management and labor to work together to identify risk, control risk and allocate resources to mitigate risk with priority of improving public transportation safety.
| Public Transportation Agency Safety Plan Measures | |
|---|---|
| Fatalities | Total amount and rate of fatalities per total vehicle revenue miles by vehicle mode. Fatalities are a confirmed death within 30 days of a reported event. |
| Injuries | Total amount and rate of injuries per total vehicle revenue miles. Injuries requiring medical attention for two or more individuals are reported. |
| Safety Events | Total amount and rate of safety events per total vehicle revenue miles. Events are a collision, derailment, fire, hazardous material spill, or evacuation. |
| System Reliability | Mean distance between major mechanical failures is calculated by the total number of vehicle revenue miles divided by major mechanical failures. |