
On This Page
Application Directory
H-GAC’s Data Analytics and Research Department is instrumental in the organization’s critical planning activities, supplying invaluable data for economic forecasting, growth projections, identifying public service needs, transportation, housing, environmental planning, and air quality research.
Accessible to all, many of the department’s research projects and reports are available below and presented through interactive mapping applications and digital storyboards. Click on the thumbnails below to view application descriptions and to launch applications You can filter applications using the list of filters listed below or select "Show All" at any time to view all applications.
Note that when you select an "External App" you will leave H-GAC's website.
Disclaimer
These applications are intended for general reference and planning purposes only. Mapping may not reflect on the ground conditions. The Houston-Galveston Area Council makes no further claims as to the accuracy or reliability of the data, and neither assumes, nor will accept liability for their use.
Application List

Transportation Planning Map

HGAC University Travel Survey Dashboard

Houston Metropolitan Area by the Numbers: Regional Insights
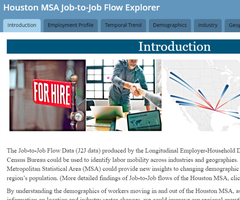
Houston MSA Job-to-Job Flow Explorer
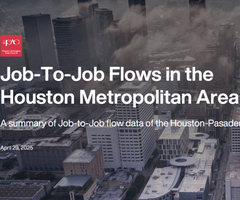
Job-To-Job Flows in the Houston Metropolitan Area
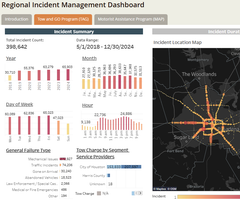
Regional Incident Management Dashboard
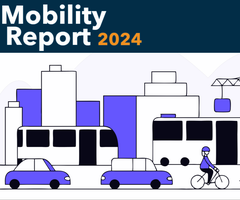
Interactive Regional Mobility Report
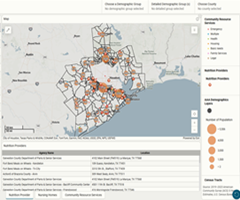
AAA Demographic Tool
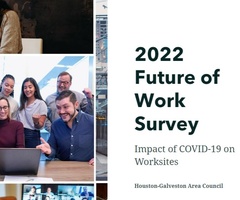
2022 Future of Work Survey
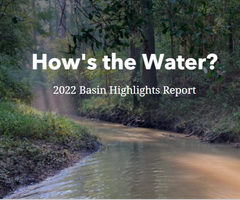
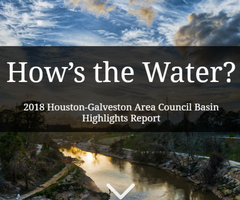
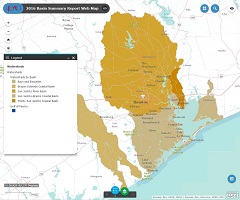
2022 Basin Highlights Report
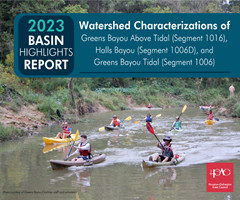
2023 Basin Highlights Report
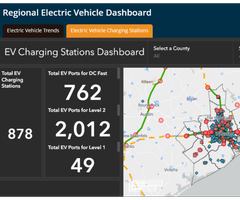
Electric Vehicles Dashboard
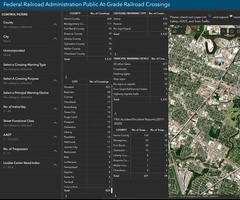
Federal Railroad Administration Public At-Grade Railroad Crossings
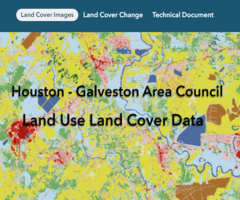
H-GAC Land Cover Application
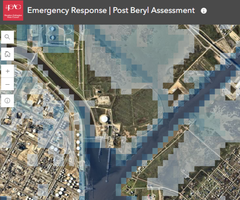
Post Beryl Assessment

Regional Broadband Development Data
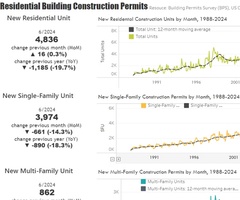
Regional Economic Indicators
Regional Goods Movement Plan

Regional Origin-Destination Dashboard
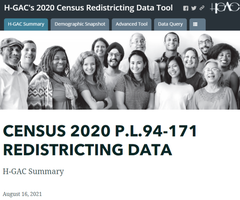
H-GAC's 2020 Census Redistricting Data Tool
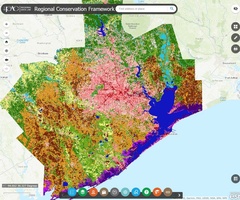
Regional Conservation Framework Tool

Regional Employer Survey
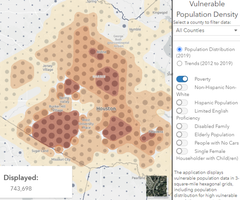
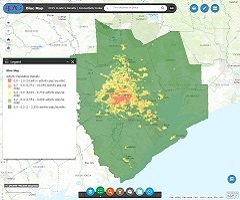
Vulnerable Population Density
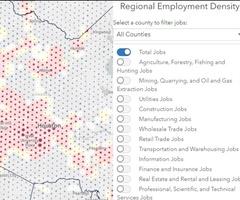
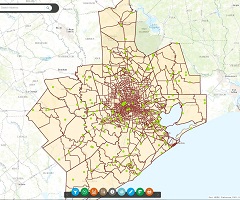
Regional Employment Density
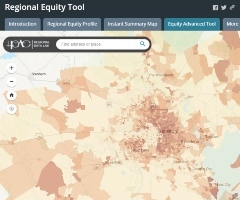
Regional Equity Tool
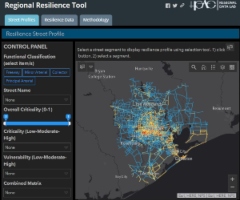
Regional Resilience Tool
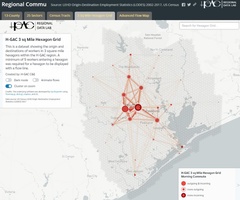
Regional Commute Flow Map
Replica Turning Movement Data
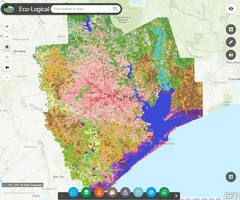
Eco-Logical GIS
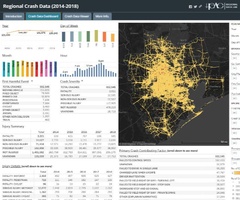
Regional Crash Data (2020-2024)
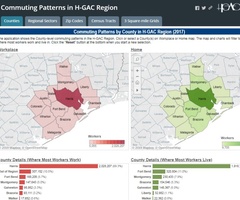
Commuting Patterns in H-GAC Region
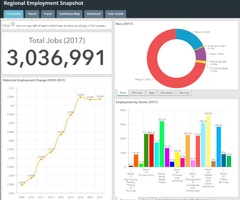
Regional Employment Snapshot
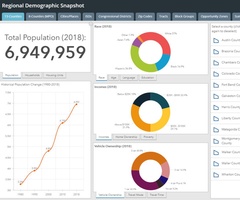
Regional Demographic Snapshot
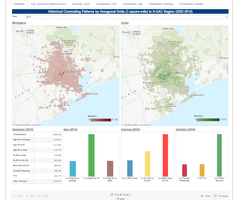
Historical Commuting Patterns

Regional Flood Information

2021 Basin Summary Report

2020 Basin Highlights Report

2019 Basin Highlights Report
2018 Basin Highlights Report

2017 Basin Highlights Report
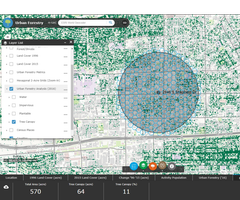
Urban Forestry
Basin Summary Report (2016)
Activity-Connectivity Explorer
Demographic Data Explorer
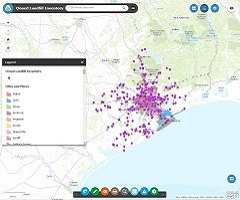
Closed Landfill Inventory
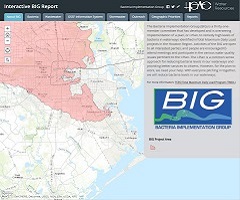
Interactive BIG Report
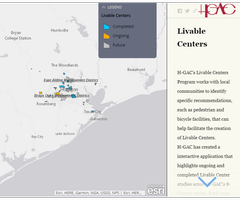
Livable Centers
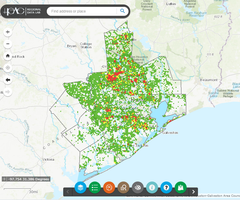
OSSF Information System
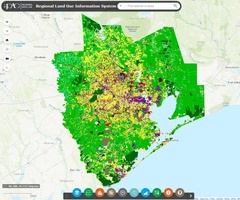
Regional Land Use Information System (RLUIS)
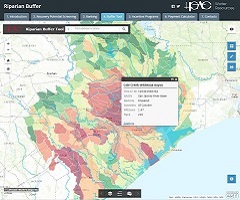
Riparian Buffer Tool
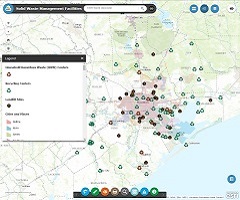
Solid Waste Facilities

Water Resources Information Map
Current 5-Year ACS Data (2020-2024)
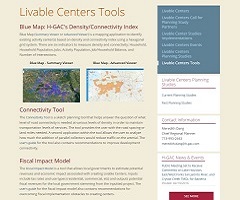
Livable Centers Connectivity Tool
Livable Centers Fiscal Impact Model
Livable Centers Benefits Calculator
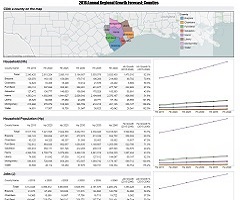
Regional Growth Forecast Report
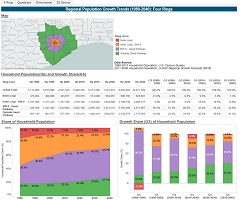
Regional Population Growth Trends (1980-2050)
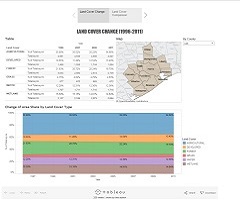
Land Cover
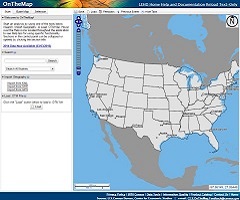
On The Map
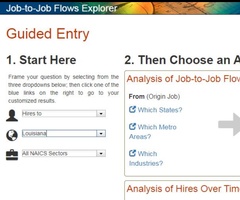
Census Job-to-Job Flows Explorer
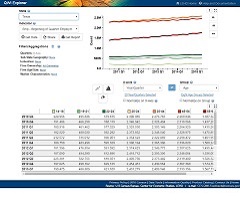
QWI Explorer
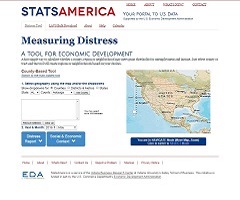
Measuring Distress
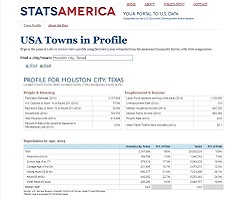
USA Towns in Profile
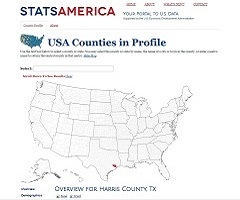
USA Counties in Profile
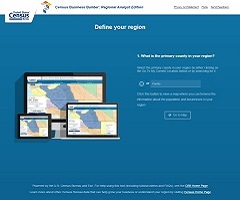
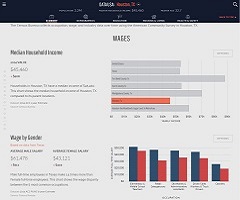
US Census Business Builder: Regional Analyst Edition
Data USA
TxDot One-Stop Demographic Data Analysis Tool

Census Reporter
Traffic Count Database System
DataLab on Social Media
